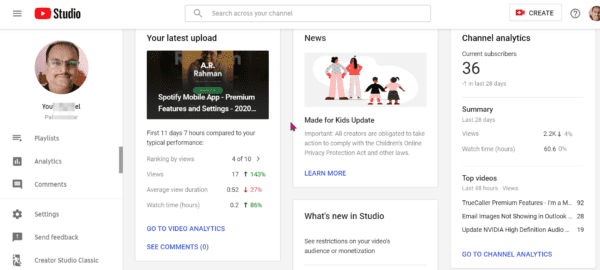
YouTube Studio gives data analytics of many things. You can see the overview of all your channel video analytics on one page in desktop. On the left hand-side you have Dashboard, Videos, Playlists, Analytics, Comments, Subtitles, Monetization and Audio Library.
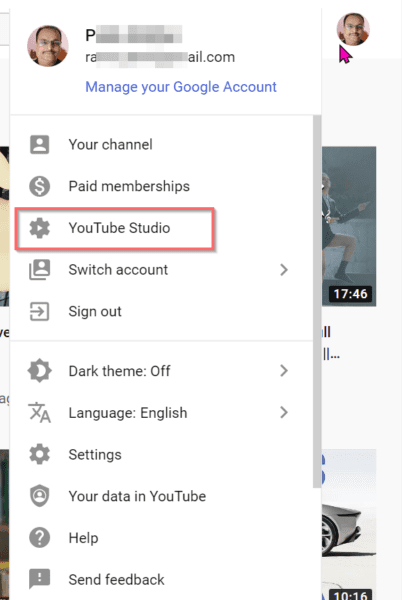
You can reach YouTube Studio by clicking the profile icon on the top-right hand corner of your desktop browser.
Below that there are 3 items – Settings, Send feedback and Creator Studio Classic. In this new version of 2020, you can see your channel analytics in a different interface.
YouTube Channel Analytics is part of the numerous features of YouTube Studio. This will give you an indication of how much time your visitors watched your videos. It is useful to understand how popular your videos are?
Related –
- Truecaller Premium Features – Top 8 Benefits of using this Caller Id App
- Samsung Galaxy M20 Review – 10 Features Suitable for 2020
- Google Drive to OneDrive Migration : 4 Different Methods [2020]
In this tutorial we are going to see the details of youtube analytics metrics that can be used to understand your videos performance.
YouTube Channel Analytics
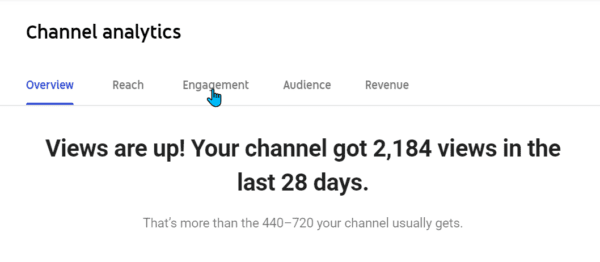
There are 5 tabs under this feature.
- Overview
- Reach
- Engagement
- Audience
- Revenue
Overview
Under this tab, you can see a glimpse of all your channel videos statistics.
- How many views increased or decreased in the past 28 days?
- How many total views your channel got?
- Your Watch time in hours
- Number of subscribers
- Your Estimated revenue from all Google-Sold Ads
- Timeline graph showing the number of views and publication date of the videos
- Your Top Videos in this period – This includes the video title, average view duration, number of views
- Real time updates – Number of subscribers, views in the last 48 hours, top videos
- Latest videos – views, average view duration, watch time in hours – Click the Video Analytics to see its detailed stats.
Related –
- How to Connect Remote Desktop in Windows 10 or 8.1 or 7
- Fix File Explorer Not Refreshing Error in Windows 10 or 8.1
Reach
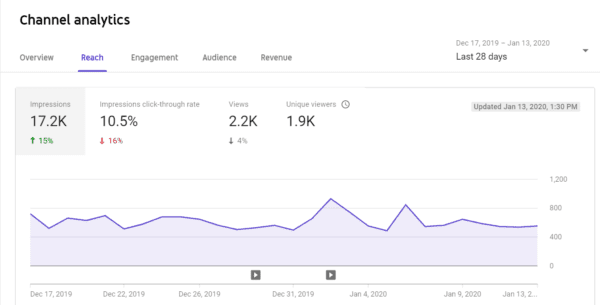
You can see the timeline graph of different YouTube channel metrics.
These include Impressions, Impressions click-through rate, views and unique views.
You can see the timeline graph for each metric. One can also watch the traffic source types for your videos.
Some of them are like this –
- YouTube Search
- Suggested videos
- External
- Direct or unknown
- Browse features
- Others
and many more.
The data for the total impressions and how they led to watch time for the past 28 days (by default) can be seen here.
The statistics for the impressions from important sources, views from impressions, watch time from impressions are also visible as a funnel.
Engagement
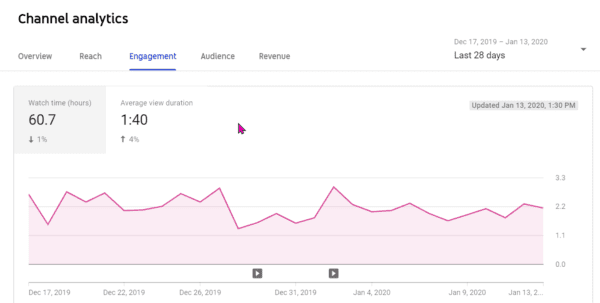
Under this tab, you can see watch time (in hours) and average view duration.
When you click each metric, corresponding time line graph over a period of 28 days by default, is displayed.
You can also see the increase or decrease in each channel analytics metric in percentage.
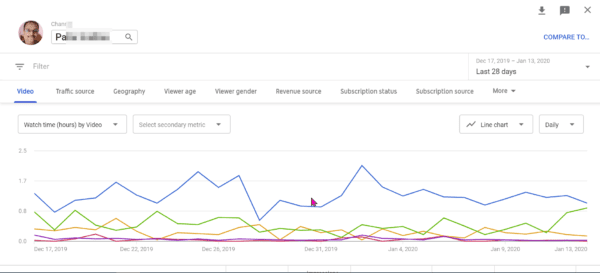
The top videos with corresponding watch hours can also be seen. If you click the “See More” item, then a pop-up screen with further option comes up. This will show the following details.
- Video
- Traffic Source
- Geography
- Viewer age
- Viewer gender
- Revenue source
- Subscription status
- Subscription source.
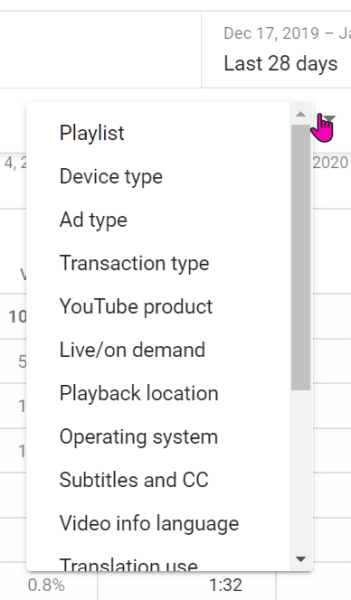
If you click the “More” item, you can see further options like –
- Playlist
- Device type
- Ad type
- Transaction type
- YouTube product
- Live/on demand
- Playback location
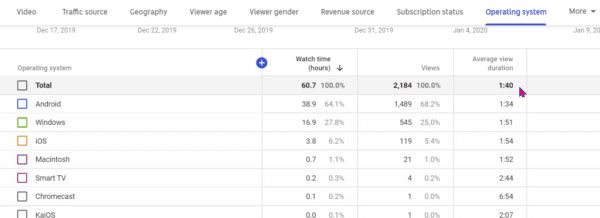
- Operating System
- Subtitles and CC
- Video info and language
- Translation use
- End screen element type
- Card type
- Card
- Sharing service
The top videos by end screen are also listed. Some of the other features of this analytical screen are top playlists, top end screen element types and top cards.
Audience
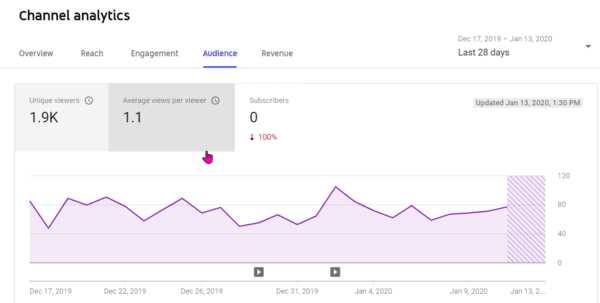
This channel feature will show unique viewers, average views per viewer and number of subscribers in the last 28 days. You can also see their corresponding timeline feature.
Watch time of different subscribers like not subscribed, unknown, subscribed etc can also be seen. Views from the top countries is also displayed as a list in percentage. Demographic data like gender and age can also be seen. Top subtitle/CC languages list with their percentage can also be seen.
Revenue
YouTube can only be monetized if you can have at least 1000 subscribers and at least 4000 hours of watch time within the past 12 months. If you have achieved that milestone, than you can see interesting statistics about your revenue.
These include estimated revenue, estimated monetized playbacks, playback-based CPM for the last 28 days. You can also see information about monthly estimated revenue, top earning videos that bought income, revenue sources, ad types and transaction revenue for the last 6 months or 28 days.
Conclusion
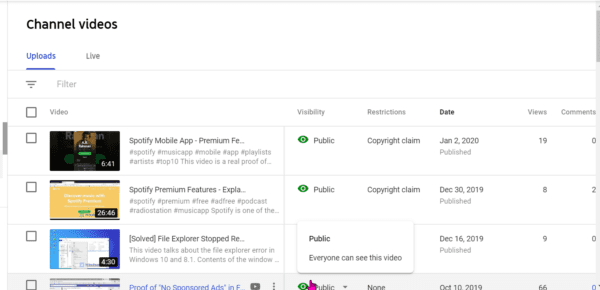
You can also watch the analytics of your channel videos by clicking the “Videos” item on the left-hand side. This will display the uploaded videos. You get different metrics like visibility, restrictions, date the video published, total number of views till now, comments, number of likes and dislikes.
I definitely found the channel analytics feature of YouTube Studio very useful. It gives an insight into videos performance and how many views, watch time they are getting.
Since the bottom part of YouTube Studio on the left-hand side is sticky, it is little difficult to navigate to channel analytics. This is frustrating, compared to the old interface. I am sure that this will change with audience requests.
In the Creator Studio Classic version it was very easy to find keywords for which the YouTube video is ranking. This helps to know your youtube channel keywords for which you are getting traffic. I didn’t find this feature in the 2020 interface of YouTube Studio.
If anybody knows how to find it, please let me know in the comments.

